Logging system
from code to destination
A call such as log.info(...) looks simple, but it may write to the console, a
file or even send data over the network. Between the code and the destination,
a pipeline filters, builds and distributes each event.
What happens when you log
The general path is:
log.info(...) → check level → build event → filter
              → encode → send to one or more appenders
If the level is disabled, the call is discarded. If it is enabled, the logger creates an event with the message, context and metadata; the encoder serializes it and the appenders send it to their destinations.
A synchronous appender writes from the current thread. An asynchronous one uses a queue, but when it fills up, it must block the application or discard logs.
How it reaches different destinations
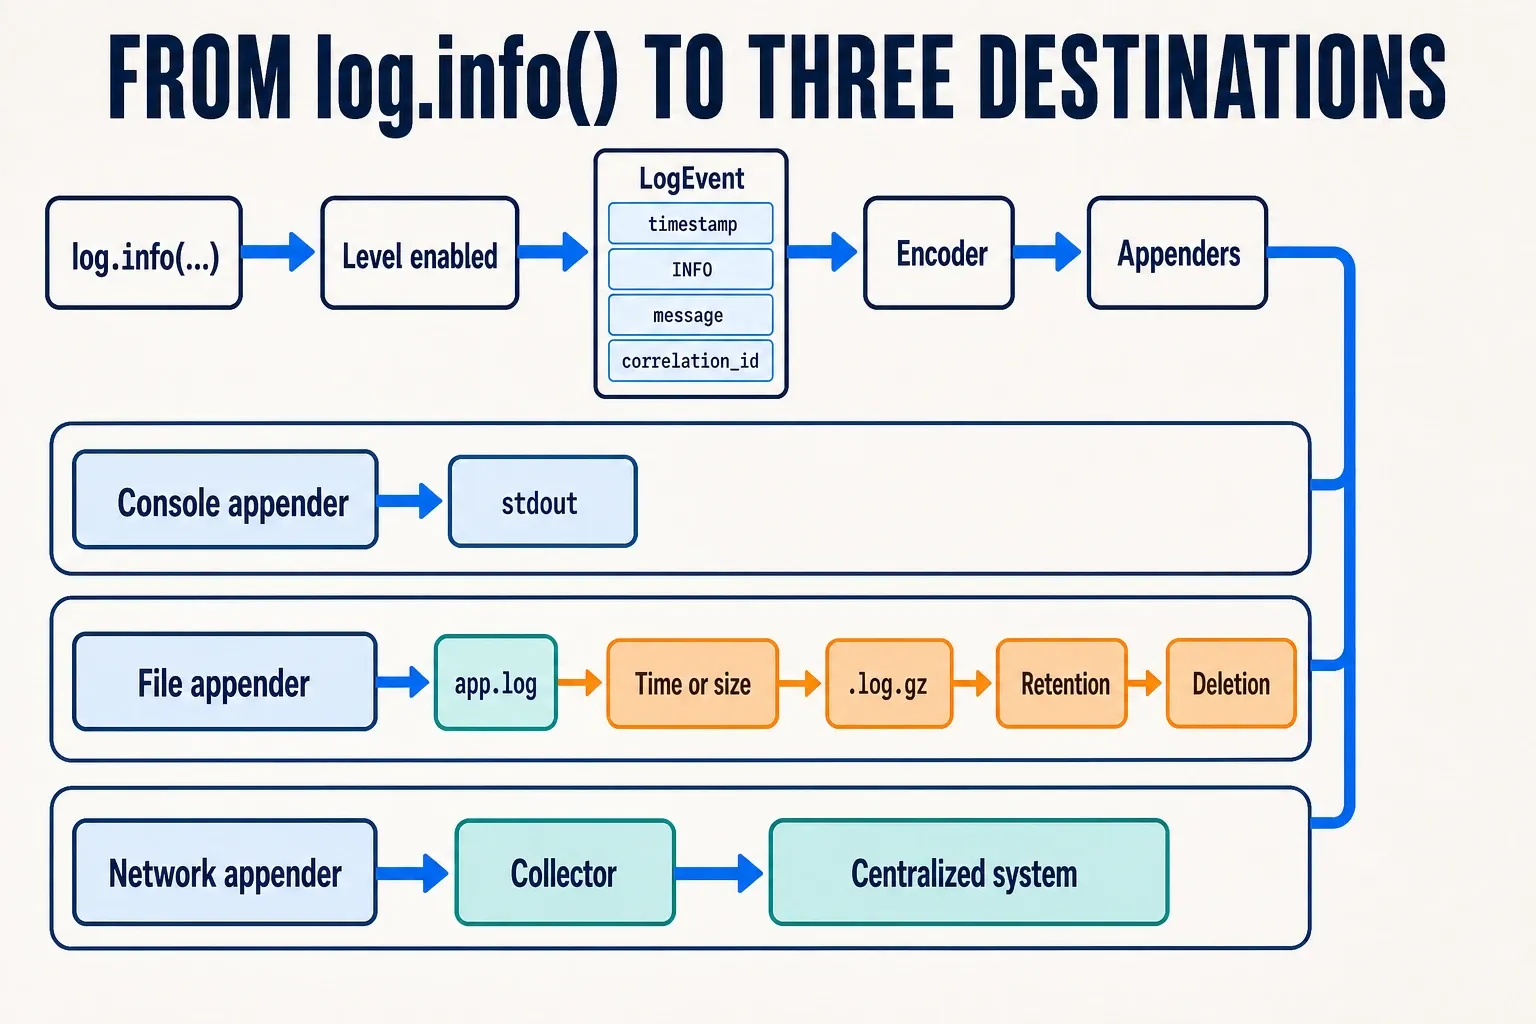
An appender decides where each event ends up:
- Console: writes to
stdoutorstderr. - File: stores logs on disk and applies rotation policies.
- Network: sends them through protocols such as Syslog or GELF. Writing to a database is also possible, although it is rarely the first choice.
- Multiple destinations: each adds serialization, input/output and its own failure mode. A disk can fill up and a network connection can block.
Logback is one implementation that lets you declare this pipeline in
logback-spring.xml:
<configuration>
  <appender name="STDOUT" class="ch.qos.logback.core.ConsoleAppender">
    <encoder>
      <pattern>%d %-5level [%X{correlation_id}] %logger - %msg%n</pattern>
    </encoder>
  </appender>

  <appender name="FILE" class="ch.qos.logback.core.rolling.RollingFileAppender">
    <file>logs/app.log</file>
    <rollingPolicy class="ch.qos.logback.core.rolling.SizeAndTimeBasedRollingPolicy">
      <fileNamePattern>logs/app.%d{yyyy-MM-dd}.%i.log.gz</fileNamePattern>
      <maxFileSize>100MB</maxFileSize>
      <maxHistory>14</maxHistory>
      <totalSizeCap>2GB</totalSizeCap>
    </rollingPolicy>
    <encoder>
      <pattern>%d %-5level [%X{correlation_id}] %logger - %msg%n</pattern>
    </encoder>
  </appender>

  <root level="INFO">
    <appender-ref ref="STDOUT" />
    <appender-ref ref="FILE" />
  </root>
</configuration>
In this example, the active file is logs/app.log. It is archived every day or
after exceeding 100MB, rotated files are compressed as .log.gz, and they are
kept for 14 days without exceeding 2GB in total. These values are only
examples and must be adjusted to the log volume and available space. Rotation,
compression, retention and the total size cap protect the disk; without these
policies, logs can degrade or stop the server when storage runs out.
Sending logs directly over the network couples the application to the external
system. It is therefore common to write to stdout or a file and let a collector
forward them to a centralized system such as Graylog or Loki.
Centralizing logs solves where to search, but not how to know which events belong to the same operation. That requires a shared identifier.
How logs are correlated
The MDC (Mapped Diagnostic Context) is a key-value map associated with the
current context. It can store a correlation_id and automatically add it to
each event through %X{correlation_id}:
MDC.put("correlation_id", correlationId);
try {
  log.info("Report generation started report_id={}", reportId);
  generateReport(reportId);
} finally {
  MDC.remove("correlation_id");
}
The finally block prevents a reused thread from mixing requests. If the
operation continues over HTTP, a queue or an asynchronous thread, the
correlation_id must be propagated and installed again: MDC does not cross
those boundaries automatically.
The report_id identifies the report; the correlation_id, the complete
operation; and the trace_id, one traced execution.