Observability
seeing system behavior
Observability is the ability to understand what is happening inside a system from the information it produces. It lets you know its state, detect problems and investigate why it behaves in a particular way.
How it works
An observable application produces three main signals:
- Logs: record specific events, such as a report being queued or completed.
- Metrics: aggregate measurements over time, such as successful reports, failed reports or average generation time.
- Traces: show a report’s journey from the request to the stored file and how long each step took.
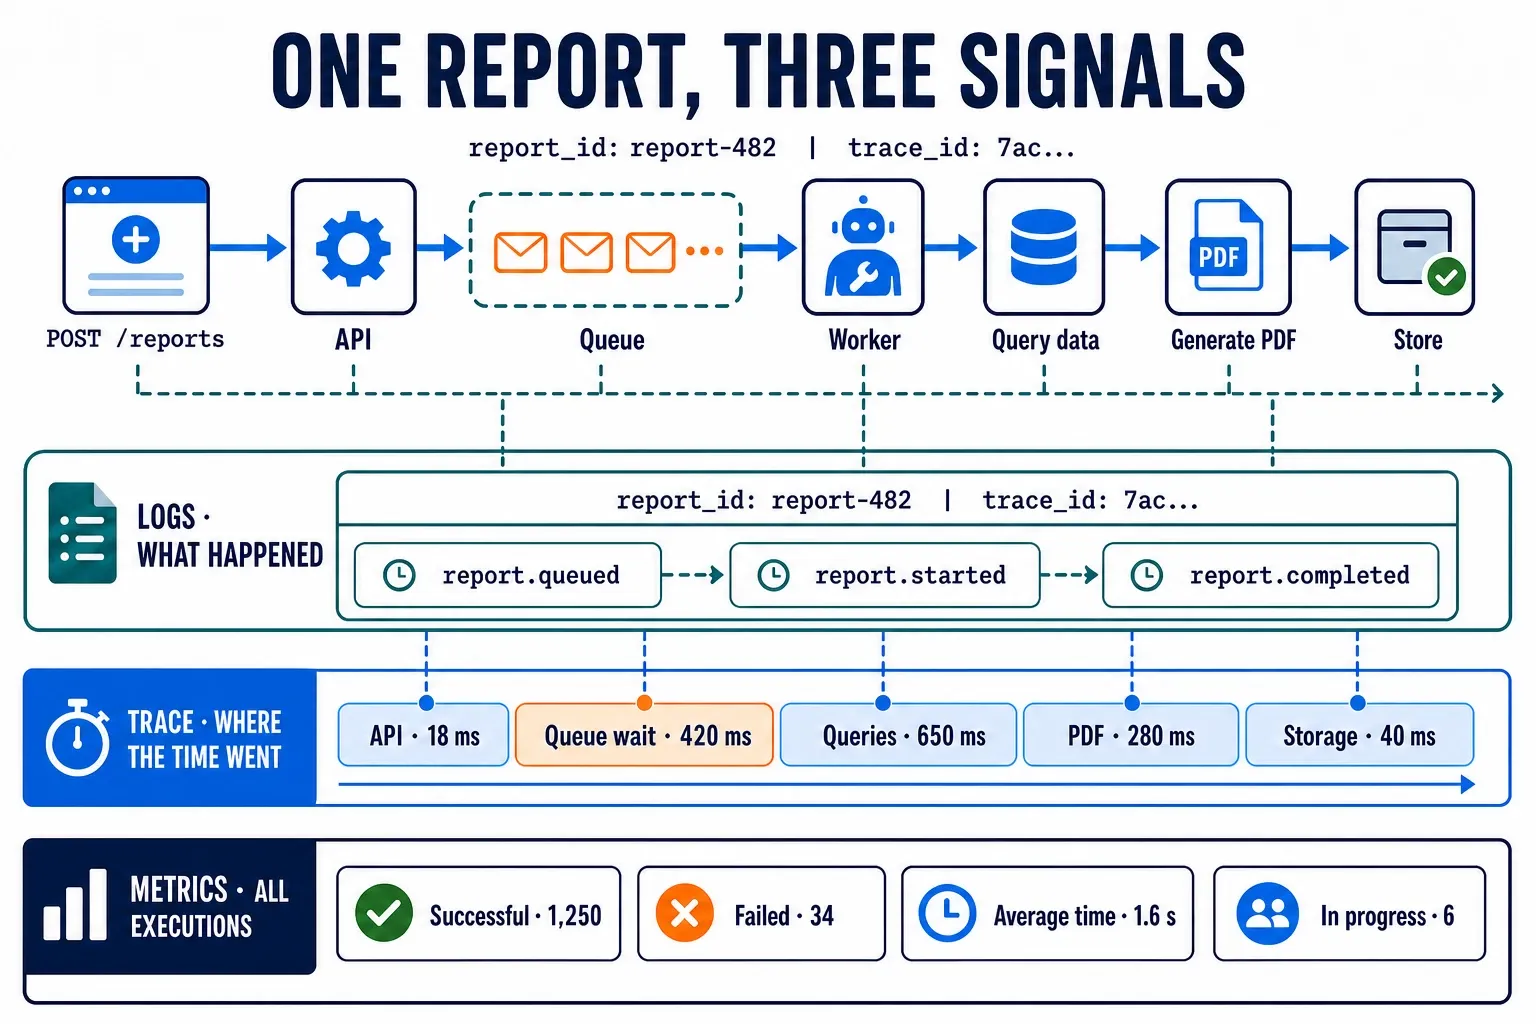
The three signals complement each other. A metric shows that generation time has increased, a trace reveals whether the wait happened in the queue or during a query, and the logs explain what happened to that report. Together they let you move from detecting a symptom to finding its cause.
In distributed systems
In a simple application, all three signals come from the same process: you can collect its logs, query its metrics and follow the generation without crossing several services. In the example, the request crosses an API, a queue, a worker and the data sources; each component produces its own part of the information.
To observe the complete journey, you need to centralize the signals and
propagate shared context. The report_id identifies the report, while the
trace_id connects its execution across services. Including both in the logs
lets you relate them to the trace, even when they were produced by different
processes or machines.